Lifetime costs of car insurance | Quotezone
20/10/2026




Reviewed by: Greg Wilson
Founder & Insurance Expert
Written by: Katie Gawley
Insurance Content Writer
Fact-checked by: Quotezone Editorial Team
This content follows our Editorial Guidelines
Last Updated: October 2026
Read time: 15 min
Car insurance costs follow a rollercoaster across a driving life. Premiums peak in the first few years on the road, fall to their lowest in the mid-60s, then climb steeply again into the 90s. But what does that add up to over a lifetime behind the wheel?
To find out, we analysed our own internal quote data from January to September 2026 to calculate the average total cost of insuring a car across a lifetime, based on the median cheapest quote at every age from 17 to 96.
We also identify the most and least expensive ages to insure a car, how costs compare between younger and older drivers, and how much of the UK State Pension car insurance takes up in later life.
Key statistics
- Drivers could spend more than £43,000 on car insurance over their lifetime if they continue driving until around 81, in line with UK life expectancy, rising to £57,158 for those still behind the wheel at 96.
- 18-year-olds face car insurance costs almost six times higher than 65-year-olds, paying £1,920 a year compared with just £337 on average, the lowest premium of any age.
- Teenage drivers face the highest annual car insurance costs, at £1,767 on average, followed by drivers in their 90s at £1,218. Both pay more than motorists in their 20s, who face average premiums of £1,128.
- Turning 19 delivers the biggest one-year car insurance saving, with premiums falling by £358, a 19% drop.
- By 96, a year’s car insurance costs £1,530, the equivalent to more than six weeks of the full new State Pension.
- Drivers must renew their licence at 70 and every three years after that, and the government has consulted on making eye tests compulsory at each renewal.
How much does car insurance cost over a lifetime?
The average UK driver can expect to pay £43,069 for car insurance over their lifetime, according to our internal data (age 17-81, the average UK life expectancy). That figure rises to £57,158 for anyone who stays behind the wheel into their mid-90s.
The figures are based on the median cheapest car insurance quote at every age from 17 to 96. These quotes show how much drivers pay across their whole driving life, not just at a single renewal.
Drivers pay £43,069 over an average lifetime
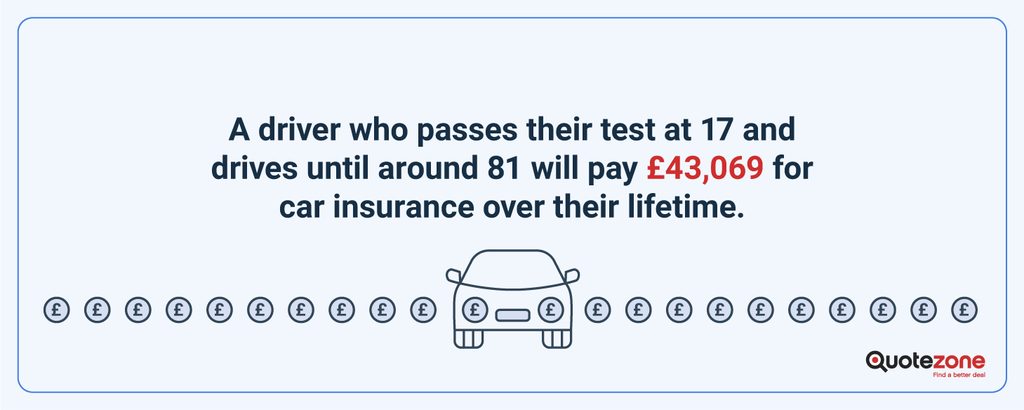
Based on ONS life expectancy figures of 79.1 years for men and 83 for women, [1] a driver who passes their test at 17 and drives until around 81 would pay £43,069 in car insurance premiums across their lifetime.
Because women tend to live longer, they may expect to spend more time on the road and to pay more over their lifetime as a result:
- Men (to age 79): £42,074
- Women (to age 83): £44,137
These figures reflect how long drivers typically live, not differences in the price men and women pay for insurance. UK insurers have not been allowed to price car insurance by gender since 2012.
Drive until 96 and the car insurance bill hits £57,158
For drivers that stay on the road into their mid-90s, data shows that lifetime cost climbs to £57,158. That’s £14,089 more than the average driver pays (if they live to 81), showing how much the costs increase between 81 and 96. It’s a bigger group than many might expect, more than 2 million people in Great Britain aged 80 and over hold a full driving licence, including 172,085 aged 90 and over. [2]
Drivers will pay almost £10,000 in car insurance by the time they turn 23
A new driver will have paid an average of £9,266 on average for car insurance by their 23rd birthday, in just six years on the road, assuming they started driving from 17 years old. By their 25th birthday, the total reaches £11,618.
Because premiums are so high in the early years, drivers pay half of the £57,158 lifetime bill in their first 30 years behind the wheel. By the age of 46, they’ll have paid £28,744. The other half is spread across the following 50 years, from 47 to 96.
Drivers pay an average of £715 a year on car insurance
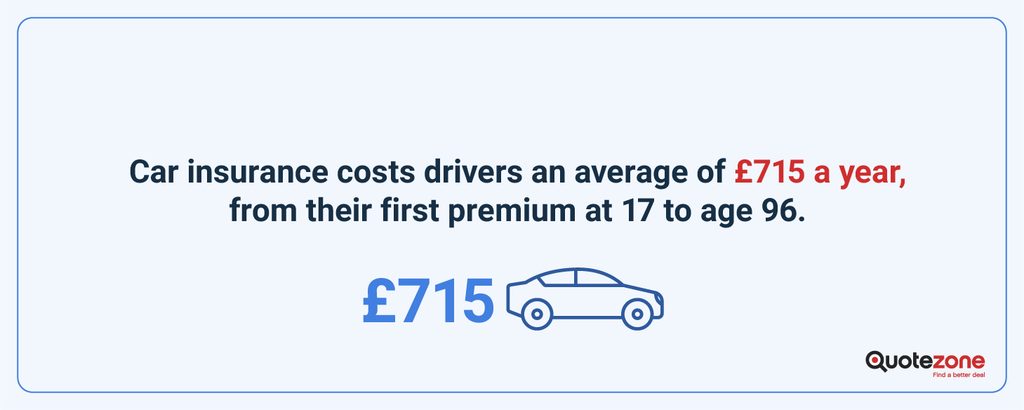
Spread across 80 years of driving, from 17 to 96, car insurance costs an average of £715 a year. For those that drive until 81, it works out at £663 a year.
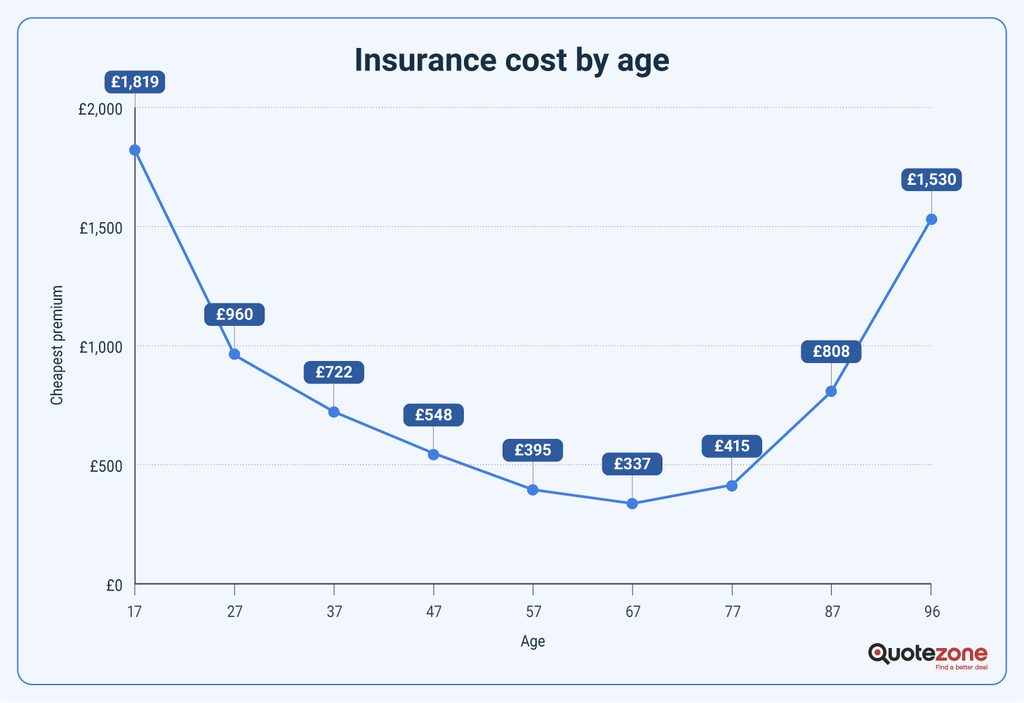
Few drivers actually pay the average in any given year, though. Premiums start at more than £1,800 at 17, fall to £337 by 65 and climb back above £1,530 by 96.
Types of car insurance
There are three main levels of car insurance cover in the UK, and every driver needs at least third party cover to drive on public roads.
- Third party only: the legal minimum. It covers damage you cause to other people’s vehicles and property, but not damage to your own car.
- Third party, fire and theft: includes everything in third party only, and also covers your car if it’s stolen or damaged by fire.
- Fully comprehensive: the highest level of cover. It protects other drivers, covers fire and theft, and pays for damage to your own car even if an accident was your fault.
How much insurance costs by age
Age is one of the biggest factors in what drivers pay for car insurance. Insurers weigh up how experienced a driver is and how likely they are to make a claim, so premiums change considerably over a driving life.
Costs are highest in the first few years on the road. They fall steadily through a driver’s 20s, 30s and 40s, and reach their lowest point in their mid-60s. From the mid-70s, premiums begin to rise again, and by their late 80s drivers could pay as much as they did in their 20s.
| Age | Average annual premium cost |
| 17 | £1,819 |
| 18 | £1,920 |
| 19 | £1,562 |
| 20 | £1,449 |
| 21 | £1,322 |
| 22 | £1,194 |
| 23 | £1,214 |
| 24 | £1,139 |
| 25 | £1,087 |
| 26 | £1,028 |
| 27 | £960 |
| 28 | £929 |
| 29 | £959 |
| 30 | £915 |
| 31 | £869 |
| 32 | £857 |
| 33 | £779 |
| 34 | £764 |
| 35 | £776 |
| 36 | £765 |
| 37 | £722 |
| 38 | £712 |
| 39 | £671 |
| 40 | £694 |
| 41 | £647 |
| 42 | £649 |
| 43 | £630 |
| 44 | £590 |
| 45 | £559 |
| 46 | £563 |
| 47 | £548 |
| 48 | £547 |
| 49 | £537 |
| 50 | £503 |
| 51 | £469 |
| 52 | £473 |
| 53 | £459 |
| 54 | £438 |
| 55 | £431 |
| 56 | £412 |
| 57 | £395 |
| 58 | £402 |
| 59 | £378 |
| 60 | £390 |
| 61 | £363 |
| 62 | £349 |
| 63 | £355 |
| 64 | £348 |
| 65 | £337 |
| 66 | £345 |
| 67 | £337 |
| 68 | £339 |
| 69 | £344 |
| 70 | £351 |
| 71 | £352 |
| 72 | £350 |
| 73 | £363 |
| 74 | £358 |
| 75 | £385 |
| 76 | £395 |
| 77 | £415 |
| 78 | £416 |
| 79 | £446 |
| 80 | £482 |
| 81 | £512 |
| 82 | £524 |
| 83 | £545 |
| 84 | £577 |
| 85 | £597 |
| 86 | £800 |
| 87 | £808 |
| 88 | £842 |
| 89 | £874 |
| 90 | £1,096 |
| 91 | £1,261 |
| 92 | £939 |
| 93 | £1,250 |
| 94 | £1,273 |
| 95 | £1,174 |
| 96 | £1,530 |
Most expensive ages for car insurance ranked
Drivers aged 18 pay more for car insurance than any other age. The costs are almost six times higher than those of drivers at the cheapest age (£337 at 65 and 67 years old).
The top three most expensive ages for a premium coincide with the first three years of driving with 17, 18 and 19 years old all being the most expensive car insurance premiums. In fact, six of the first seven years of driving are all among the most expensive, from 17 through to 23 with 22 being the exception.
The higher costs aren’t just associated with younger drivers though, with four ages in the 90s making it into the top 10 most expensive ages for car insurance.
Insurance isn’t the only costly aspect of running a vehicle either, with our study on the most expensive cars to run showing that the average cost to run a car is £13,364 a year, which includes additional costs as well as insurance.
| Rank | Age | Average annual premium |
| 1 | 18 | £1,920 |
| 2 | 17 | £1,819 |
| 3 | 19 | £1,562 |
| 4 | 96 | £1,530 |
| 5 | 20 | £1,449 |
| 6 | 21 | £1,322 |
| 7 | 94 | £1,273 |
| 8 | 91 | £1,261 |
| 9 | 93 | £1,250 |
| 10 | 23 | £1,214 |
Most affordable ages for car insurance ranked
Drivers aged 65 and 67 years old pay the least for car insurance at £337 a year, which is £1,583 less than an 18-year-old pays. Prices for those in their 60s are the cheapest with seven of the ten most affordable prices being for those in this age group.
All of the ten cheapest premiums are for those aged between 62 and 72, with prices staying low for over a decade, and they’re all separated by no more than £15.
| Rank | Age | Average annual premium |
| 1 | 65 | £337 |
| 2 | 67 | £337 |
| 3 | 68 | £339 |
| 4 | 69 | £344 |
| 5 | 66 | £345 |
| 6 | 64 | £348 |
| 7 | 62 | £349 |
| 8 | 72 | £350 |
| 9 | 70 | £351 |
| 10 | 71 | £352 |
When looking at insurance costs by region, drivers aged 65 located in Wales pay the least (£248.19) and those in London pay the most (£431.20).
Average car insurance costs per UK region
As previously mentioned, age is just one of the factors used to calculate a driver’s car insurance premium. Where you live, your past driving experience and the type of car you own are all factors in how much car insurance you might pay.
As part of the research, we analysed our internal quote data to calculate the average total cost of insuring a car in each UK region, based on the median cheapest quote.
| Rank | UK Region | Average annual car insurance premium |
| 1 | South West England | £581 |
| 2 | Wales | £606 |
| 3 | East of England | £635 |
| 4 | East Midlands | £652 |
| 5 | South East England | £655 |
| 6 | North East England | £661 |
| 7 | Scotland | £669 |
| 8 | Yorkshire | £739 |
| 9 | Northern Ireland | £744 |
| 10 | North West England | £748 |
| 11 | West Midlands | £811 |
| 12 | London | £916 |
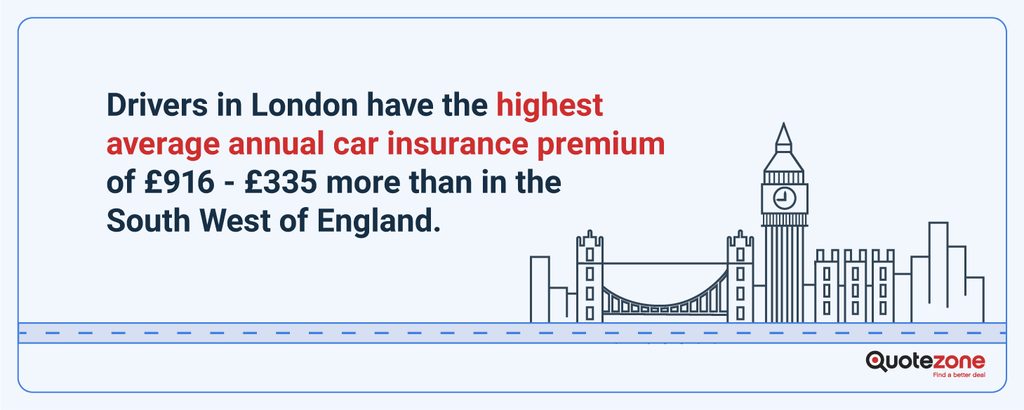
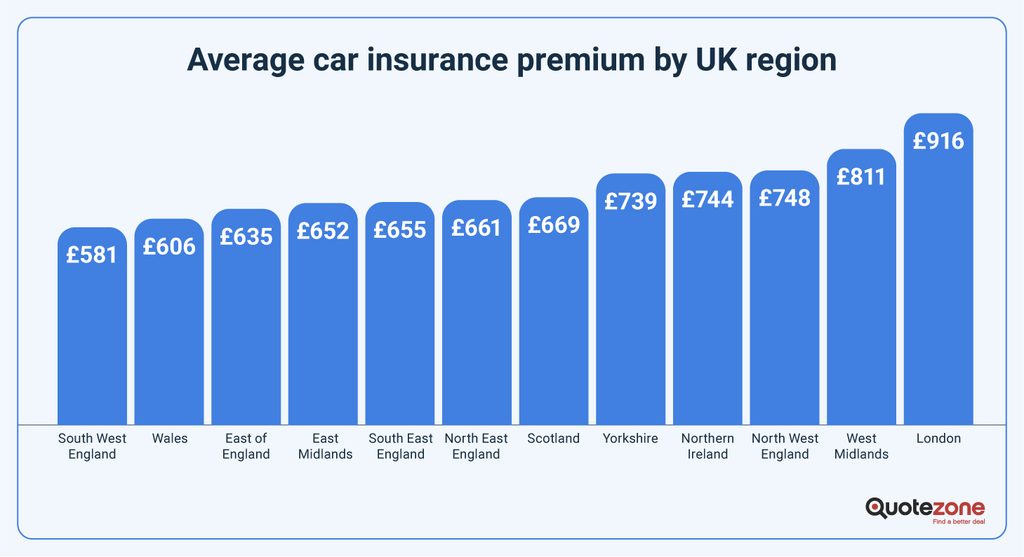
The research shows that drivers in London could face the highest average car insurance premiums at £916, £335 more than in the South West of England, which has the lowest average insurance premium (£581).
The average across all regions is £701, but five regions sit above this: Yorkshire (£739), Northern Ireland (£744), North West England (£748), West Midlands (£811) and London (£916).
However, this means that seven regions sit under this national average. In Wales the average annual car insurance premium is £606, and in Scotland the average is £669.
Eastern regions including the East of England (£635), East Midlands (£652) and the South East of England (£655) also all sat below this national average.
Average car insurance costs by age and UK region
The research also delved into the average car insurance cost by both age and UK region to calculate the average lifetime costs across the country.
17 year-olds in Northern Ireland face the highest average insurance costs at £2,497 a year. This is over £1,000 more than 17 year-olds in the South West of England pay on average (£1,494).
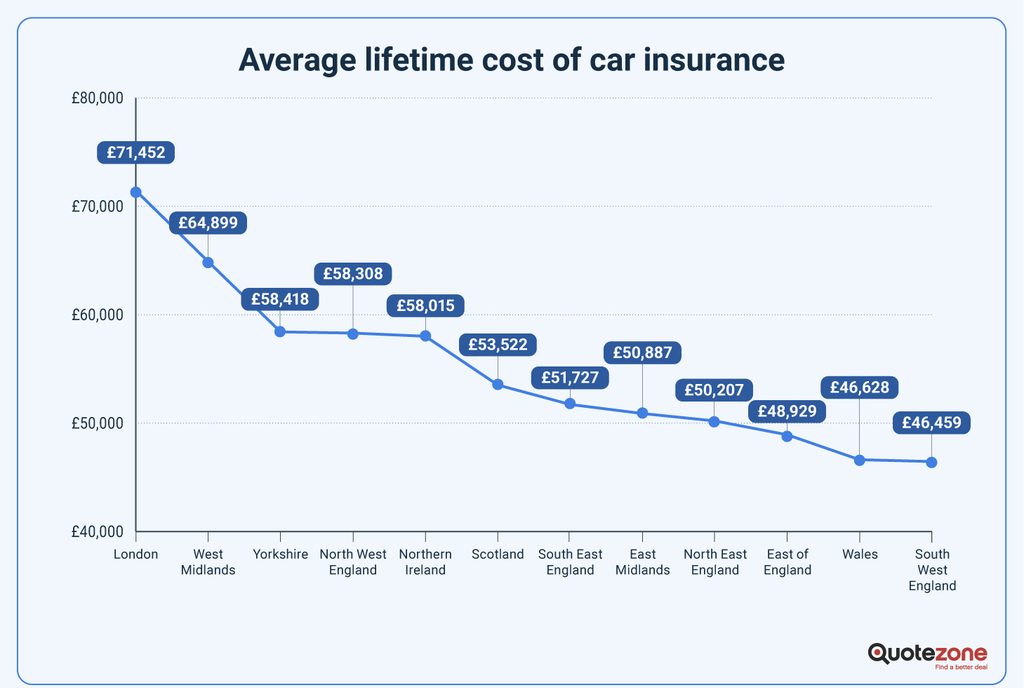
Although not every region in the data has quotes for drivers up to age 96, based on the internal quote data showing the average cheapest quote, drivers in London face the highest lifetime car insurance costs, totalling £71,452 until age 94.
In the West Midlands, drivers will pay an average of £64,899 on car insurance from 17-96, and in Yorkshire the lifetime car insurance cost totals £58,418 until age 95, the second and third most expensive regions in the study.
On the other hand, motorists in the South West of England will pay the lowest average car insurance costs across their lifetime, at £46,459 right up until age 96. Closely following this is Wales, where drivers will pay an average of £46,628 across their lifetime until 94 (excluding age 93 where the data for this specific age was not available). The third cheapest region is the East of England, where lifetime car insurance costs total £48,929 on average until age 93.
| Age | East Midlands | East of England | London | North East England | North West England | Northern Ireland | Scotland | South East England | South West England | Wales | West Midlands | Yorkshire |
| 17 | £1,629 | £1,521 | £1,972 | £1,790 | £1,929 | £2,497 | £1,868 | £1,536 | £1,494 | £1,693 | £1,893 | £2,000 |
| 18 | £1,828 | £1,704 | £2,225 | £1,956 | £1,867 | £2,384 | £1,857 | £1,738 | £1,708 | £1,627 | £2,037 | £2,105 |
| 19 | £1,524 | £1,289 | £2,125 | £1,411 | £1,667 | £1,678 | £1,340 | £1,445 | £998 | £1,397 | £2,029 | £1,840 |
| 20 | £1,258 | £1,265 | £1,895 | £1,512 | £1,438 | £1,423 | £1,306 | £1,401 | £1,141 | £1,094 | £1,958 | £1,698 |
| 21 | £1,344 | £1,170 | £1,747 | £1,326 | £1,377 | £1,239 | £1,080 | £1,172 | £1,043 | £1,129 | £1,702 | £1,536 |
| 22 | £1,143 | £1,251 | £1,522 | £1,105 | £1,532 | £1,098 | £1,137 | £1,018 | £930 | £924 | £1,374 | £1,297 |
| 23 | £1,093 | £1,130 | £1,517 | £1,504 | £1,416 | £995 | £964 | £1,103 | £870 | £1,059 | £1,486 | £1,431 |
| 24 | £1,072 | £1,002 | £1,612 | £1,216 | £1,235 | £981 | £836 | £1,203 | £824 | £905 | £1,464 | £1,318 |
| 25 | £1,098 | £1,043 | £1,596 | £889 | £1,113 | £921 | £1,107 | £933 | £808 | £1,105 | £1,415 | £1,022 |
| 26 | £975 | £954 | £1,517 | £988 | £1,110 | £853 | £968 | £914 | £867 | £809 | £1,243 | £1,143 |
| 27 | £824 | £779 | £1,235 | £1,063 | £1,042 | £802 | £858 | £834 | £892 | £718 | £1,266 | £1,204 |
| 28 | £1,050 | £857 | £1,128 | £760 | £939 | £792 | £1,009 | £923 | £727 | £940 | £1,153 | £874 |
| 29 | £1,130 | £852 | £1,398 | £914 | £933 | £778 | £811 | £740 | £658 | £823 | £1,337 | £1,131 |
| 30 | £911 | £827 | £1,146 | £1,191 | £1,016 | £733 | £895 | £862 | £627 | £790 | £912 | £1,065 |
| 31 | £765 | £792 | £1,070 | £831 | £989 | £756 | £864 | £806 | £684 | £794 | £1,020 | £1,063 |
| 32 | £752 | £772 | £1,140 | £1,008 | £982 | £746 | £685 | £795 | £759 | £814 | £974 | £858 |
| 33 | £701 | £723 | £1,026 | £713 | £891 | £657 | £815 | £733 | £721 | £620 | £861 | £885 |
| 34 | £692 | £606 | £995 | £951 | £841 | £714 | £723 | £780 | £674 | £604 | £851 | £737 |
| 35 | £722 | £734 | £1,000 | £644 | £882 | £668 | £713 | £680 | £669 | £716 | £1,014 | £869 |
| 36 | £767 | £680 | £992 | £682 | £896 | £593 | £680 | £693 | £691 | £700 | £918 | £891 |
| 37 | £656 | £673 | £975 | £652 | £862 | £612 | £602 | £657 | £641 | £630 | £987 | £721 |
| 38 | £777 | £665 | £900 | £661 | £793 | £605 | £687 | £621 | £555 | £590 | £825 | £861 |
| 39 | £671 | £716 | £861 | £590 | £769 | £574 | £658 | £651 | £479 | £564 | £744 | £778 |
| 40 | £657 | £735 | £865 | £715 | £732 | £545 | £614 | £722 | £598 | £611 | £836 | £697 |
| 41 | £598 | £543 | £883 | £677 | £732 | £549 | £623 | £651 | £529 | £600 | £789 | £596 |
| 42 | £561 | £649 | £740 | £637 | £832 | £550 | £630 | £524 | £548 | £680 | £846 | £590 |
| 43 | £632 | £588 | £749 | £752 | £575 | £534 | £588 | £625 | £530 | £555 | £739 | £690 |
| 44 | £517 | £672 | £804 | £505 | £672 | £522 | £612 | £526 | £475 | £455 | £731 | £592 |
| 45 | £543 | £582 | £754 | £550 | £585 | £523 | £501 | £515 | £482 | £487 | £640 | £545 |
| 46 | £535 | £577 | £804 | £537 | £671 | £522 | £616 | £504 | £446 | £455 | £542 | £542 |
| 47 | £525 | £512 | £682 | £546 | £640 | £507 | £508 | £468 | £484 | £494 | £653 | £555 |
| 48 | £544 | £501 | £825 | £487 | £631 | £513 | £487 | £471 | £402 | £488 | £651 | £570 |
| 49 | £535 | £479 | £793 | £522 | £514 | £512 | £465 | £539 | £463 | £446 | £620 | £552 |
| 50 | £508 | £450 | £614 | £426 | £565 | £528 | £493 | £512 | £368 | £467 | £687 | £417 |
| 51 | £362 | £453 | £586 | £511 | £497 | £481 | £484 | £375 | £379 | £441 | £539 | £521 |
| 52 | £492 | £410 | £580 | £410 | £490 | £479 | £504 | £410 | £386 | £468 | £532 | £510 |
| 53 | £447 | £438 | £578 | £495 | £493 | £482 | £376 | £394 | £375 | £443 | £506 | £480 |
| 54 | £414 | £457 | £665 | £432 | £490 | £435 | £374 | £399 | £354 | £378 | £455 | £409 |
| 55 | £405 | £464 | £504 | £411 | £495 | £478 | £393 | £429 | £327 | £346 | £466 | £458 |
| 56 | £377 | £413 | £585 | £379 | £424 | £455 | £397 | £391 | £340 | £305 | £487 | £394 |
| 57 | £366 | £428 | £528 | £366 | £444 | £450 | £327 | £380 | £289 | £316 | £430 | £421 |
| 58 | £346 | £393 | £576 | £361 | £454 | £444 | £362 | £368 | £337 | £371 | £420 | £391 |
| 59 | £326 | £401 | £528 | £363 | £394 | £422 | £344 | £346 | £302 | £285 | £460 | £363 |
| 60 | £379 | £397 | £495 | £368 | £399 | £423 | £322 | £419 | £337 | £312 | £429 | £401 |
| 61 | £299 | £367 | £577 | £304 | £362 | £419 | £359 | £328 | £301 | £277 | £421 | £342 |
| 62 | £325 | £328 | £488 | £327 | £386 | £420 | £329 | £337 | £268 | £271 | £354 | £354 |
| 63 | £327 | £329 | £496 | £334 | £356 | £415 | £346 | £315 | £286 | £287 | £411 | £357 |
| 64 | £305 | £329 | £499 | £391 | £340 | £404 | £304 | £306 | £280 | £258 | £415 | £348 |
| 65 | £290 | £336 | £431 | £305 | £385 | £417 | £326 | £308 | £280 | £248 | £387 | £331 |
| 66 | £308 | £320 | £515 | £329 | £345 | £410 | £314 | £305 | £262 | £272 | £408 | £351 |
| 67 | £311 | £340 | £433 | £299 | £363 | £421 | £331 | £315 | £248 | £278 | £392 | £319 |
| 68 | £320 | £335 | £422 | £290 | £342 | £438 | £327 | £327 | £269 | £295 | £406 | £298 |
| 69 | £314 | £329 | £481 | £306 | £352 | £425 | £307 | £322 | £279 | £297 | £383 | £332 |
| 70 | £326 | £355 | £418 | £336 | £358 | £437 | £353 | £315 | £309 | £281 | £408 | £316 |
| 71 | £315 | £307 | £451 | £338 | £357 | £467 | £361 | £325 | £291 | £287 | £377 | £352 |
| 72 | £324 | £311 | £507 | £315 | £367 | £470 | £309 | £333 | £286 | £321 | £343 | £315 |
| 73 | £321 | £377 | £449 | £351 | £342 | £470 | £358 | £333 | £305 | £305 | £369 | £380 |
| 74 | £329 | £346 | £422 | £326 | £354 | £501 | £359 | £328 | £304 | £292 | £388 | £349 |
| 75 | £396 | £373 | £481 | £351 | £393 | £514 | £334 | £365 | £324 | £320 | £394 | £376 |
| 76 | £371 | £386 | £551 | £377 | £407 | £519 | £366 | £361 | £317 | £321 | £389 | £378 |
| 77 | £376 | £403 | £490 | £389 | £419 | £566 | £383 | £368 | £358 | £373 | £430 | £421 |
| 78 | £368 | £403 | £540 | £375 | £423 | £557 | £379 | £415 | £368 | £344 | £401 | £422 |
| 79 | £411 | £407 | £620 | £422 | £447 | £571 | £417 | £426 | £355 | £382 | £473 | £421 |
| 80 | £483 | £424 | £671 | £413 | £513 | £661 | £427 | £440 | £403 | £405 | £494 | £445 |
| 81 | £482 | £489 | £585 | £474 | £545 | £731 | £453 | £438 | £413 | £433 | £596 | £500 |
| 82 | £465 | £507 | £688 | £497 | £524 | £705 | £477 | £489 | £484 | £424 | £528 | £498 |
| 83 | £505 | £541 | £687 | £502 | £571 | £691 | £533 | £490 | £456 | £444 | £578 | £539 |
| 84 | £570 | £520 | £764 | £454 | £579 | £740 | £565 | £556 | £526 | £437 | £655 | £560 |
| 85 | £572 | £562 | £779 | £661 | £618 | £748 | £599 | £528 | £512 | £460 | £591 | £529 |
| 86 | £778 | £754 | £1,041 | £758 | £874 | £979 | £706 | £717 | £640 | £655 | £866 | £834 |
| 87 | £626 | £864 | £1,007 | £782 | £905 | £1,043 | £902 | £702 | £688 | £749 | £709 | £721 |
| 88 | £717 | £811 | £1,047 | £720 | £1,019 | £1,092 | £749 | £837 | £701 | £691 | £914 | £813 |
| 89 | £752 | £822 | £1,400 | £679 | £877 | £1,030 | £823 | £765 | £921 | £602 | £997 | £824 |
| 90 | £752 | £1,074 | £2,023 | £1,274 | £1,197 | £1,110 | £969 | £995 | £801 | £701 | £1,229 | £1,031 |
| 91 | £903 | £954 | £1,377 | £898 | £1,199 | £1,436 | £1,041 | £950 | £892 | £2,695 | £1,614 | £1,177 |
| 92 | £825 | £608 | £1,743 | £783 | £1,063 | £929 | £914 | £867 | £689 | £755 | £1,153 | |
| 93 | £1,251 | £776 | £1,625 | £825 | £1,555 | £1,485 | £1,309 | £1,148 | £849 | £1,427 | £1,498 | |
| 94 | £1,423 | £1,015 | £2,211 | £1,053 | £1,370 | £842 | £1,085 | £1,125 | £1,335 | |||
| 95 | £760 | £1,749 | £1,301 | £884 | £1,178 | |||||||
| 96 | £1,201 | £2,184 | £1,266 | £1,469 | ||||||||
| Total lifetime cost | £50,887 | £48,929 | £71,452 | £50,207 | £58,308 | £58,015 | £53,522 | £51,727 | £46,459 | £46,628 | £64,899 | £58,418 |
*Blank cells represent missing age data.
One birthday could reduce car insurance by £358
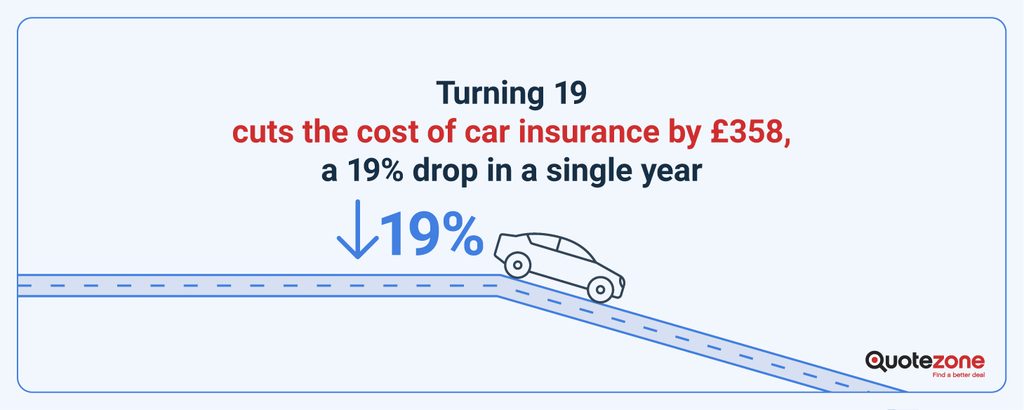
The biggest savings from one year to the next are for those turning 19, going from the most expensive premium at 18 years old to the third most expensive at 19. Despite the premium being one of the highest, there’s still a £358 drop (-19%), nearly double the second-biggest drop, which is from ages 21 to 22, which reduces by £128 (-10%).
| Rank | Age range | Saving | % drop |
| 1 | 18 to 19 | £358 | 19% |
| 2 | 21 to 22 | £128 | 10% |
| 3 | 20 to 21 | £127 | 9% |
| 4 | 19 to 20 | £113 | 7% |
| 5 | 32 to 33 | £78 | 9% |
Younger drivers vs older drivers
Younger and older drivers endure the most expensive costs of car insurance, with most of this being associated with risk. But are younger and older drivers the riskiest on the road?
Drivers aged 17 to 24 make up just 6.3% of full licence holders but account for 19% of car driver deaths. Drivers aged 70 and over hold 14.8% of licences but account for 27% of car driver deaths. Together, younger and older drivers have the highest rates of people killed or seriously injured per billion miles travelled of any age group. [3] This could help explain why 85% of Brits back tougher rules for new drivers, with almost three-quarters (73%) supporting extra restrictions during their first two years on the road.
But since 2004, the number of young drivers killed or seriously injured has fallen by 64%, while the number of older drivers has risen by 14%. [3]
Your 90s cost more a year to insure than your 20s
The teenage years are the most expensive time for an annual premium, followed by the 90s. That’s despite them being the two smallest age groups in the data. Only three teenage ages can legally drive in the UK (17, 18 and 19), and our data for the 90s covers ages 90 to 96. Even so, drivers in both groups pay more per year than at any other age range despite having fewer ages in their groups.
Across Europe, the minimum driving age varies. Drivers can begin at 15 in France under accompanied driving rules, while in Germany and the Netherlands 17-year-olds can drive under the same conditions. However, while drivers in France, Germany, the Netherlands, Italy, Spain and Belgium generally must be 18 to obtain a full car driving licence, in the UK, drivers can obtain a full licence at 17 after passing their driving test. [4]
When looking at the totals, for those in their 20s the consistently high prices drive the total up to £11,281 across the decade. But teen years and 90s may likely be lower due to there being fewer years analysed. Drivers in their 60s have the cheapest insurance throughout a ten-year period totalling £3,507, less than a third of the most expensive period (20s).
| Group | Age range | Total | Average per year |
| Teens | 17 to 19 | £5,301 | £1,767 |
| 20s | 20 to 29 | £11,281 | £1,128 |
| 30s | 30 to 39 | £7,830 | £783 |
| 40s | 40 to 49 | £5,964 | £596 |
| 50s | 50 to 59 | £4,360 | £436 |
| 60s | 60 to 69 | £3,507 | £351 |
| 70s | 70 to 79 | £3,831 | £383 |
| 80s | 80 to 89 | £6,561 | £656 |
| 90s | 90 to 96 | £8,523 | £1,218 |
Retirees pay over £20,000 for car insurance
Retirement accounts for just over a third (35%) of the £57,158 lifetime cost of car insurance, at an average of £654 a year across 31 years, from state pension age (66) to 96.
Premiums are lowest in the early years of retirement and rise with each decade that follows. Drivers pay more for car insurance from 86 to 96 (£11,847) than in the previous 20 years of retirement combined (£8,433).
| Ages | Total | Average per year |
| 66 to 75 | £3,524 | £352 |
| 76 to 85 | £4,909 | £491 |
| 86 to 96 | £11,847 | £1,077 |
At 96, car insurance costs six weeks of state pension
The full new State Pension is £241.30 a week, or £12,547.60 a year. [5] As premiums rise in later life, car insurance takes up a growing share of that income.
At 66, a year’s car insurance costs less than a week and a half of State Pension. By 91, it costs five weeks, and by 96, more than six weeks’ worth of a pension.
Across all of retirement, from 66 to 96, car insurance costs the equivalent of 84 weeks (1.7 year’s worth) of State Pension. For a driver who stops driving at around 81, in line with average UK life expectancy, it’s the equivalent of 26 weeks, or around six months of State Pension.
| Age | Average annual premium | Weeks of State Pension | Share of annual State Pension |
| 66 | £345 | 1.4 | 2.7% |
| 71 | £352 | 1.5 | 2.8% |
| 76 | £395 | 1.6 | 3.2% |
| 81 | £512 | 2.1 | 4.1% |
| 86 | £800 | 3.3 | 6.4% |
| 91 | £1,261 | 5.2 | 10.1% |
| 96 | £1,530 | 6.3 | 12.2% |
What are the rules for older drivers in the UK?
Drivers aged 70 and over make up 14.8% of full licence holders in Great Britain. [3] There’s no upper age limit for driving in the UK, but the rules change once drivers reach 70.
Licence renewal and eyesight rules
A driving licence expires at 70, and drivers must then renew it every three years. Renewal is free and can be done online or by post, using the D46P form that the DVLA sends out 90 days before a driver’s 70th birthday. [6] Renewing a licence doesn’t involve retaking the driving test, which may come as a relief to many. A recent Quotezone survey found that 61% of UK drivers believe they would fail if they had to retake their test today.
When renewing, drivers must confirm that they meet the minimum eyesight standard for driving. That means being able to read a number plate from 20 metres away, about the length of five parked cars, with glasses or contact lenses if needed. [7] At the moment, drivers declare this themselves, and no eye test is required.
Drivers of any age must also tell the DVLA about any medical condition that could affect their driving.
Could older drivers face compulsory eye tests?
The government has consulted on introducing compulsory eyesight tests for drivers aged 70 and over. Under the proposals, drivers would need an eye test when they renew their licence at 70 and at every renewal after that, with more frequent testing possible from 75, 80 and 85. The consultation ran from January to May 2026, and the government has not yet published its response. [8]
Government road casualty data shows that when older drivers are involved in collisions, defective eyesight is 15 times as likely to be recorded as a contributing factor as it is for other drivers. [3]
Methodology
This analysis uses internal car insurance premium data from January to September 2026 to explore how costs vary across a driver’s lifetime. We examined three key datasets: average premiums by UK region, national average premiums by single year of age, and combined age-by-region averages to understand how pricing fluctuates geographically and across life stages.
To calculate lifetime costs, we used the national average premium by age as the baseline. Annual premiums were mapped from age 17 (the earliest typical driving age) through to age 96.
Lifetime total cost was calculated by summing the average premium for each age year. The “lifetime average” represents the mean annual premium across all ages included in the analysis.
Quote volumes vary by age, with significantly fewer quotes available for drivers in their 90s than for other age groups. Figures for these ages should therefore be treated as indicative. Where there was insufficient data for a specific age within a region, that age was excluded from the regional lifetime totals.
Supplementary data was taken from external sources to provide additional context, including road casualty statistics from the Department for Transport, insurance claims data from the Financial Conduct Authority’s Financial Lives survey and first car ownership data from Auto Trader.
All figures are presented in GBP and reflect quoted premiums at the time of data collection.
Sources
- Office for National Statistics, ‘National life tables – life expectancy in the UK: 2022 to 2024’, 2025
- Driver and Vehicle Licensing Agency, ‘GB Driving Licence Data – 15 August 2026‘, 2026
- Gov.uk, ‘Reported road casualties in Great Britain: younger and older car drivers factsheet, 2025’, 2026
- Oculamor, ‘European Driving Age Limits: A Comparative Guide for UK Parents’, 2026
- Gov.uk, ‘The new State Pension: What you’ll get’
- Gov.uk, ‘Renew your driving licence if you’re 70 or over’
- Gov.uk, ‘Driving eyesight rules’
- Gov.uk, ‘Introducing mandatory eyesight testing for older drivers’, 2026
Photo credit – iStock.com valentinrussanov
This article is intended as generic information only and is not intended to apply to anybody’s specific circumstances, demands or needs. The views expressed are not intended to provide any financial service or to give any recommendation or advice. Products and services are only mentioned for illustrative rather than promotional purposes.