

The garden nightmare most home insurance won’t cover
Homeowners are being warned that their insurance won’t likely cover any damage caused by an invasive plant which grows rapidly…
* Savings based on representative cost savings from June 2025.
Home or house insurance is designed to protect your home and its contents. It can help with the cost of replacing or repairing damage or losses. Covered events will depend on your specific insurance policy. But this insurance typically protects from fires, storms, theft and floods.
Coverage options include building insurance and contents insurance, which come separately or combined into one building and contents policy.
There are two main types of home coverage which can be bought separately, or combined into one policy. These include:
Building insurance covers your home, its fixtures and fittings, and any outbuildings, pathways and boundaries like walls, fences or gates. It can also include underground services like water and sewage pipes, septic tanks and oil or gas tanks.
Contents insurance covers any personal possessions the policy owner is legally responsible for in the house. This means furniture, electronics, clothes and valuables like paintings or jewellery.
This cover will usually pay out the market value of the contents. However, you can opt for “new for old” cover, which does not make deductions based on the wear and tear of the items, so they will be replaced with brand-new equivalents.
Buildings and contents insurance combines the cover of both buildings and contents policies into one package.
It can often be cheaper than buying the policies separately and can be easier to manage with only one premium and renewal date.
Insuring your home is not necessary under UK law. However, lenders often require it as part of your loan agreement if you have a mortgage. You can tailor your insurance to meet your specific needs with the following policies.
Being responsible for an entire property and its contents can be costly when things go wrong. The average pay-out for a homeowner’s claim was £6,002 in 2024**. Comparing this to the average home insurance cost in the UK, which is currently £274, it’s clear that not insuring our home could be more expensive in the long run.
Landlords insurance, also known as buy-to-let or rental property insurance provides specialised cover for landlords. It lets you cover multiple properties on one policy while protecting your building and any furnishings that are rented along with the property.
As a tenant or lodger, you are not responsible for home insurance. However, you can still protect your valuable belongings like gadgets or jewellery from being stolen or damaged with renters insurance, or contents insurance for tenants.
If you own a second home or holiday home, you can take out a second home policy. Specialised coverage can also provide cover for letting out the property to others, or renting the property on Airbnb.
This cover focuses on insuring your possessions while you live in halls or shared accommodation. You can insure the belongings you keep in your private room with specialised student contents insurance.
Sometimes a traditional policy won’t provide the protection your home needs. Non-standard home insurance provides additional protection for homes that require special coverage, including listed buildings and those with a higher risk of flooding or subsidence.
Unoccupied property insurance is required for a vacant or empty home left unoccupied for over 30 consecutive days. This type of home has inherently higher risks and will need to have adequate cover in place.
If you own and live in a flat or an apartment, you can find insurance policies tailored specifically for this type of home. Learn more about flat insurance here.
The average cost of home insurance in the UK is £274 going into 2025.
This cost varies depending on various factors including the type of property you own, and where you live. This is because your location lets insurers know the risks to your home in your area. Things like local repair and labour costs, crime rates, flood risks, and the overall number of claims for your region all impact costs.
This is why the insurance comparison experts at Quotezone have broken down the average price of home insurance by region.
Get all the latest home insurance price data, including annual cost increases, crime rates, council tax rises, and more.
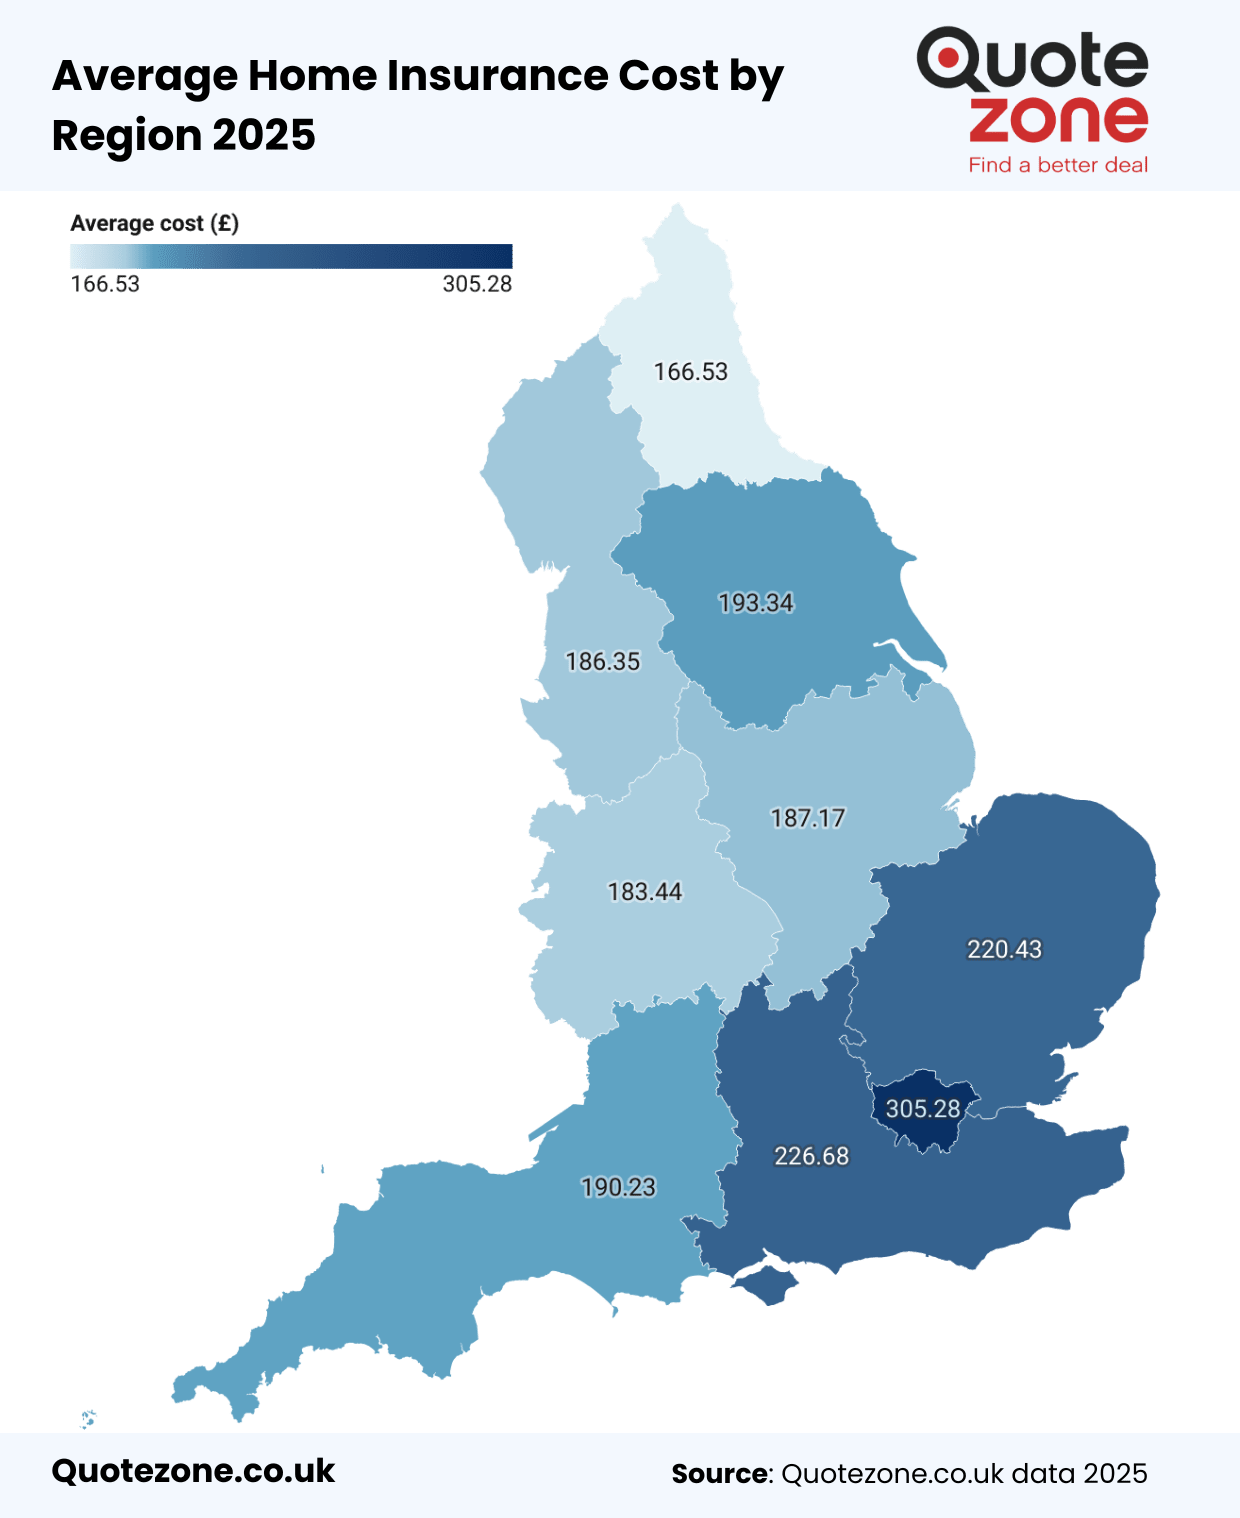
| Regions | Average Annual Cost Q1 2023 | Average Annual Cost Q1 2024 | Average Annual Cost Q4 2024 |
|---|---|---|---|
| London | £181.15 | £289.38 | £305.28 |
| South East | £133.94 | £197.23 | £226.68 |
| East of England | £136.14 | £192.68 | £220.43 |
| South West | £115.56 | £166.14 | £190.23 |
| West Midlands | £119.63 | £163.48 | £183.44 |
| East Midlands | £122.63 | £166.43 | £187.17 |
| North West | £118.51 | £168.73 | £186.35 |
| Yorkshire and The Humber | £127.92 | £170.69 | £193.34 |
| North East | £108.55 | £158.12 | £166.53 |
The average cost of insuring a home has risen 60% in England alone since 2023. So you won’t be alone if you are struggling more than usual to find a cheap home insurance policy. However, understanding how your personal circumstances and other factors influence your quote is key to finding cheaper quotes. Here are some tips to start:
This is a huge decision that will impact your property insurance costs for the foreseeable future. The size, materials, and type of your home will all indicate the cost to repair it. Our research shows that detached homes cost 35% more to insure than semi-detached homes.
The location of your home lets insurers know a lot about its risk level. They will be able to find out the flood risks and crime rates in your area. This is why it is so important to do your research and know what red flags to look out for when you are viewing a home.
Any additional coverage you add to your policy can come at an additional price. So always choose only the coverage you really need when you compare quotes. Estimate your rebuild cost accurately so you do not over-insure.
You could also choose to increase the excess on your policy to reduce the premium. Just know that this will mean paying a little more out of pocket each time you make a claim.
Providers will usually charge less if you pay your premium annually rather than monthly. This is because you avoid the added interest that is applied when you pay monthly. By paying your insurance monthly you are essentially entering into a credit agreement with your insurer.
Continued home maintenance means you lower the risk of developing issues that result in claiming your insurance. A good no-claims history can get you cheaper home insurance policies when you start to compare quotes.
Improving home security makes you less of a risk to insure, so could reduce the premiums on both home and contents policies. Insurers often reward measures like installing security lights, house alarms, and BSI (British Standards Association) approved locks like a 5 lever mortice deadlock.
Although insurance providers consider similar factors when calculating your insurance cost, each uses its own pricing model that gives different importance to each factor. That’s comparing quotes is so important when you are looking for the cheapest quotes. Different insurers could also offer incentives like rewards or free gifts which you can benefit from.
While policies can vary, most cover damage or loss caused by:
Again, this can vary. Your policy details will always clearly outline exclusions. Common exclusions from home cover are:
Covers unexpected and accidental damage caused to your home or its contents. This can include damages caused by you or your family like breaking windows or cracking floor tiles.
Home emergency protection offers fast help with the cost of repairing damages that put the occupant’s health or safety at risk. This could be a broken heating system or burst pipes.
Provides temporary alternative accommodation if our home isn’t safe to stay in. Your policy documents will outline these events, which usually include flooding, fire, or storm damage.
Protects your bicycle against damage or theft while you store it at home. This option is available whether you keep your bike in a shed or hallway.
Covers the cost of getting legal help or advice for disputes related to your property. An example would be a boundary dispute or noise complaint.
This gives you additional coverage that can include valuables you take outside of the home like jewellery, instruments, or devices. You can also insure these separately under gadget insurance.
While garages that are attached to your property will usually be covered by home insurance, some providers will not cover separate buildings. Outbuilding insurance can cover these gaps, as well as lockups outside of your property.
1. Basic details about the home
This includes the property type. For example, a semi-detached, three-bedroom house. The history of the home, including when it was built, the main building materials and if it is a listed building. It’s also helpful to know about the home’s security features like the alarm system and the type of locks on the main external door.
2. Rebuild costs and contents value
It’s important to get these right because the values you give will be the maximum amount you are paid out when making a claim. Our quote form can help give you an estimated value to rebuild the property based on the basic information you provide.
However, it is always best to do your research to get an accurate rebuild value and find out how much it would cost to replace the entire contents of your home.
3. The level of cover you want
You can choose between buildings insurance, contents insurance, or a combined buildings and contents policy. You can insure specific items worth over £1,000, or items you take outside your home. You can also choose extra coverage like home appliance protection, and the excess you want on the policy.
We search up to 40 home insurance providers to save you hassle and money
Compare Home Insurance
We search up to 40 home insurance providers to save you hassle and money
Home insurers will have different guidelines when it comes to claiming on your insurance. But each will follow the same general process.
1. Contact your insurer to notify them of the damage or loss as soon as you can.
2. The insurer will carry out an investigation which may require proof of ownership, receipts and estimates for any repairs.
3. The claim will be either rejected or settled fully or partially by the insurer.
4. The insurer might identify an at-fault party who is liable for the damages to recover their costs.
Quotezone compares cheap home insurance quotes from up to 40 trusted UK insurers. Searching multiple providers is the easiest way to find a competitive premium. Quotes for the same property and risk profile can differ by hundreds of pounds depending on the insurer, so comparing the panel below in one search saves time and helps you find cheaper home insurance for your circumstances. Every insurer on Quotezone’s panel is FCA-authorised, and you can switch between buildings, contents, or combined cover at the quote stage to see how each option affects the price. Premiums also depend on factors like property age, rebuild cost, postcode, and claims history — so the right insurer for one household won’t necessarily be the right one for another.
Comparing quotes from multiple UK insurers in one search is one of the easiest ways to find cheap home insurance. Quotes for the same property can vary by hundreds of pounds across providers, so comparing the panel of around 40 insurers on Quotezone gives you a fair view of the market in a few minutes. To bring premiums down further, consider increasing your voluntary excess, paying annually rather than monthly (monthly is technically a credit agreement and adds interest), and fitting approved security like 5-lever mortice deadlocks on external doors. Avoid stacking unnecessary add-ons you won’t use, and review your cover at each renewal rather than letting it auto-renew at last year’s price.
There is no single cheapest insurer because home insurance pricing depends on factors specific to your property and circumstances — including the rebuild cost, postcode flood risk, claims history, and how much contents cover you need. An insurer that is cheapest for a new-build flat in Surrey may be one of the more expensive for a Victorian terrace in Glasgow. The most reliable way to see who offers the cheapest cover for your home is to compare quotes side-by-side. Quotezone’s panel includes around 40 UK insurers, all FCA-authorised. Premiums also tend to be lower if you have continuous claim-free years, modern security features, and a lower voluntary excess threshold you’re comfortable with.

“One of the most common reasons people overpay for buildings cover is insuring their home at market value rather than rebuild cost. Rebuild cost is usually significantly lower than what the property would sell for, especially in popular areas. The ABI publishes a regular rebuild cost guide that’s worth checking before every renewal.”
Helen Rolph, Insurance Expert, Quotezone
Reviewed by: Helen Rolph
Home, Travel & Pet Insurance Expert
Written by: Deirbhile Coyle
Insurance Content Writer
Fact-checked by: Quotezone Editorial Team
This content follows our Editorial Guidelines
Last Updated: 18 July 2025
Homeowners are being warned that their insurance won’t likely cover any damage caused by an invasive plant which grows rapidly…

Home exchange, sometimes called house swapping, is becoming an increasingly popular way to travel in the UK while reducing accommodation…

Homebuyers are being warned not to overlook property red flags which could result in unexpected costs of up to £53,000. …

With winter energy bills expected to rise, experts from Quotezone provide simple and effective tips for reducing your energy bills…

Households are being urged to conduct simple boiler checks before the UK is hit with freezing temperatures, to ensure homes…

Homeowners are being urged to step up security measures as data reveals more than 100,000 burglaries took place in the…
I found it very useful but made my purchase through Easyfundraising and no donation has been received.
Joan-hazel Amos
Verified Reviewer
I got the best deal for home insurance.
Ruth Tarff
Verified Reviewer
4.88/5 from 166 customer reviews
References
**https://www.abi.org.uk/news/news-articles/2024/112/year-to-date-property-claims-payouts-hit-4.1-billion/
*51% of consumers could save £241.88 on their Home Building & Contents Insurance. The saving was calculated by comparing the cheapest price found with the average of the next fourteen cheapest prices quoted by insurance providers on Seopa Ltd’s insurance comparison website. This is based on representative cost savings from June 2025. The savings you could achieve are dependent on your individual circumstances.